Subject: Best Practices in Communication Networks II (PKS II), Department of Telecommunications, Faculty of electrical engineering and computer science, VSB-TUO.
Name: Bc. Kryštof Šara (SAR0130)
Date of presentation: October 25, 2024
introduction
In the field of monitoring, the vizualisation tools are vital for the human operators to analyze the currect situation on the network, hardware or in the system, and to decide on the operation being executed next.
implementation
used hardware and software
- Raspberry Pi 4B 8GB + GPIO
- simple breadboard and wires
- VISHAY BPV10NF photodiode
rrdtool
wiring up

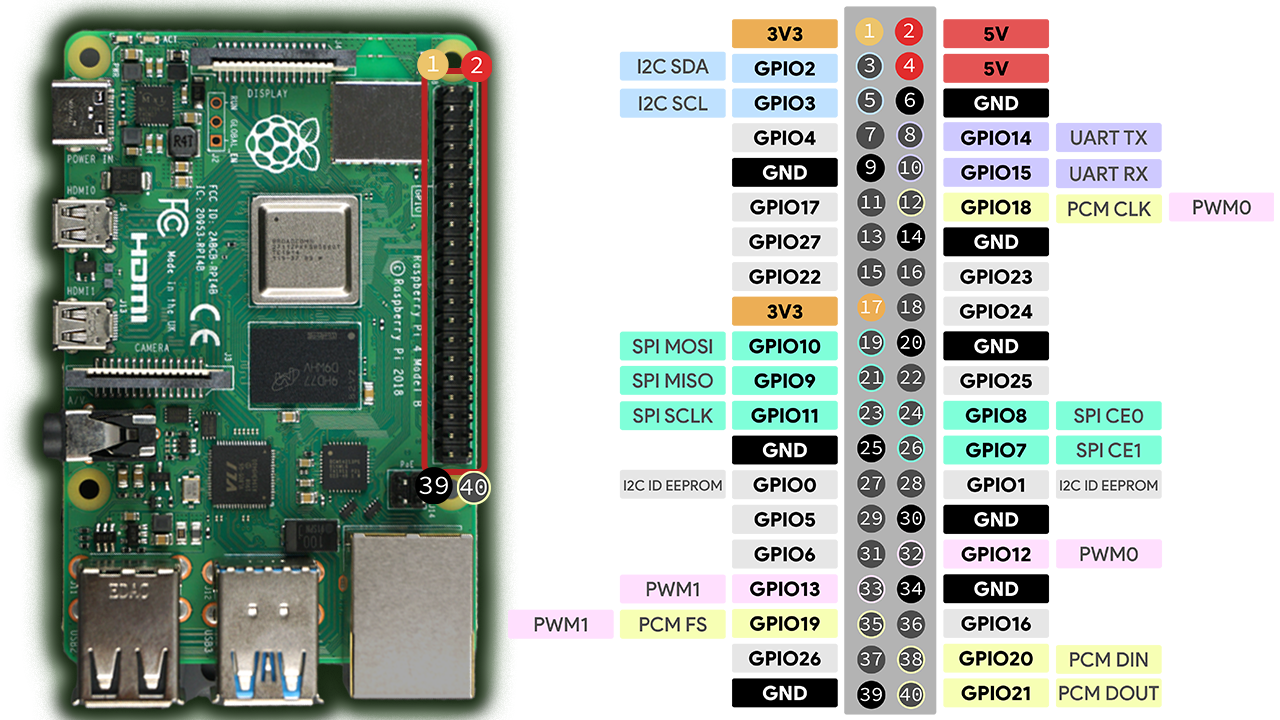
Fig. 1: Raspberry Pi 4B GPIO Pinout scheme.
For the purpose of wiring the photodiode up with the Raspberry Pi desk computer, we are going to use GPIO (General Purpose Input/Output). The pinout scheme is shown in the figure 1. For the purpose of interconnection, pins 17 (3V3) and 37 (GPIO 26) are to be used.
installation
Next part deals with the data collection, storing and vizualisation. For this purpose, the rrdtool will be used.
To start using the RRDTool, one has to perform an installation at first. We need to update the repository package list before that to ensure we have the latest package database. Possibly we could upgrade the system too before installing a new software as it is the recommended procedure.
From here, we can now install the rrdtool itself. The main metapackage contains all the necessary tooling, so we don’t need to install anything else now. [1]
| |
RRDTool
We need to create a RRDB database file first:
| |
data collection script
The data collection itself is carried out using the simple shell script which periodivally updates the RRDB database file.
data source
The data values stored in the database file come from the simple python3 script to operate the GPIO interface of the Raspberry Pi 4B desk computer.
| |
visualization
Unfortunately, I did not succeed in measing of the light intensity directly, so decided to use the photodiode to catch the Morse code recording.
For this purpose I periodically covered and uncovered the breadboard with the photodiode circuit to demonstrate ups (high voltage) and downs (low voltage).

Fig. 2: A PKS sign encoded into the Morse code in rrdtool-generated graph.

Fig. 3: International Morse code specification. [2]
conclusion
Visualization is the key part of monitoring, analyzing and reacting to incidents in the telecommunications. Tools like RRDTool are one of the simpliest ones, still, they are widely used and utilized in the core networking overviews and in the networking stats too.
references
| reference number | reference content |
|---|---|
| [1] | NEVLUD, Pavel. Komunikační sítě II pro integrovanou výuku VUT a VŠB-TUO. Ostrava: 2014. Katedra telekomunikační techniky, Vysoká škola báňská-Technická univerzita Ostrava. |
| [2] | https://en.wikipedia.org/wiki/Morse_code |