![]()
Subject: Cyber Security II (KB II), Department of Telecommunications, Faculty of electrical engineering and computer science, VSB-TUO
Name: Bc. Kryštof Šara (SAR0130)
Date of presentation: May 10, 2024
Task syllabus:
- design and configuration of test topology using network monitoring tools - Zabbix, Nagios, including their configuration
- description of the methods used to maintain high availability and their practical example
introduction
As far as modern computational systems are concerned, it is common to ensure those are operational no matter what happens. Those systems are commonly present in healthcare centres, military facilities, energy infrastructure companies, or government operations.
high availability
High-availability (HA) is a type of operation, where the system behaves, in ideal conditions, as unified even though it is composed of various backed up routes and networking and computational modules. Those systems are often called the failover clusters. Their main responsibility is to ensure continuous operation even if one part of the chain fails — ensuring so-called zero system downtime. In terms of the application layer of ISO/OSI model, those systems mainly act as load-balancers — evenly propagating ingress traffic between two or more edge nodes —, or traffic redirectors. [1]
Common parts of HA systems include:
- redundancy
- replication
- failover
- fault tolerance
monitoring of systems and services
Systems monitoring is a vital element when considering HA system deployment. Each component of such system should be properly configured, deployed, and ensured is monitored too. Monitoring should be centralized as the monitoring operator is to manage and control important system nodes and elements. Those systems consist of networking parts, and application parts to put it simply. [2]
It is common that monitoring centres (a.k.a. Network Operations Centres, NOCs) also maintain remote configuration of such primitives, backup statuses of important failover nodes, restore mechanisms and disaster recovery testing. Using monitoring, one should be able to check each critical part’s health and status to evaluate a possible incident impact. When the incident happens, monitoring centres are the very first ones to act and escalate such failure in the system chain. [2] [3]
Typical NOC operations include: [3]
- installing and updating software on interconnected systems
- data backing up and restoring
- firewall and network software monitoring
- software patching
- network health and performance analysis
- disaster recovery testing
- rapid incident handling
- downtime elimination
- network optimization
 Fig. 1: European Space Agency Network Operations Centre, (Photo: ©ESA) [4]
Moreover, systems monitoring include data (metrics) collection — actual system performance facts like CPU usage, RAM utilization, ingress and egress traffic and more. The very next step in metrics collection is the data vizualization using graphs, charts and diagrams. [2]
NOCs often cooperate with so-called SOC (Security Operations Centre) and help-desks in bigger facilities. SOC is however often the next part in the escalation matrix, mitigating denial of services and security attacks, as well as building protections and maintaining IPS/IDS deployments. As far as help-desks are concerned, operators there act like a communication platform for clients to answer their complaints and operational issues. [3]
The most common tools for business monitoring are these:
- Zabbix
- Nagios
- Prometheus (+Grafana and Loki)
demonstration
In this chapter, a simple load balancing on the L4 ISO/OSI layer is to be implemented, to ensure high-availability for three redundant services — DNS server, web server, and mail server.
used hardware and tooling
- Raspberry Pi 4B 8 GB
- python3 3.11.2
- mininet 2.3.0
- Raspbian (bookworm) OS
- iperf3 to evaluate the upstream link*
- iptables
- MariaDB server
- nginx as web server
- bind9 as DNS server
- postfix as mail server
- Zabbix tooling (mainly server and agent)
*The connection itself had been really hard to establish for iperf3 tool, therefore was not mentioned in the project any further.
topology
A simplified topology diagram can be seen in the Fig. 2. The whole network is connected to the internet via one link between root host (Raspberry Pi, upstream) and router R1. The three services are distributed redundantly behind routers R2 and R3 (and switches S2 and S3 respectively).
Nodes H1 and H2 are to be used for monitoring (Zabbix and Nagios).
Three main network subnet groups are utilized:
10.1.1.0/30- the edge Internet connectivity link
10.1.2.0/30,10.1.2.4/30- core routers’ links
10.1.3.0/27,10.1.3.32/27,10.1.3.64/27- hosts’ subnets, links to switches
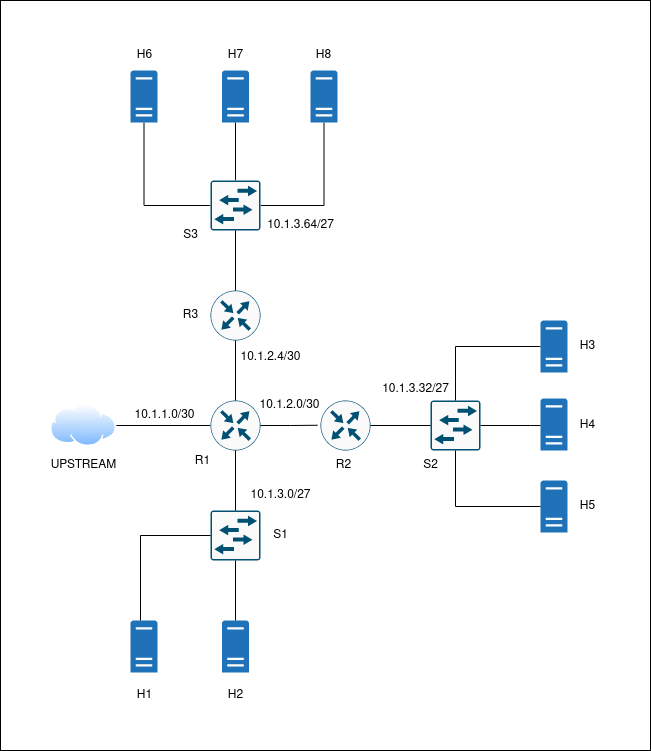 Fig 2: Network topology diagram. All main links are shown. Links are (universally) assigned the nearby subnet’s IP addresses. Switches are switching the whole subnet.
mininet installation
The mininet package is available in the common Raspbian/Debian repositories, so after the repos update, we can directly install python3.11 and mininet packages.
python environment settings
To use the python lib for mininet, we need to setup a virtual environment (kb2_mininet) first. After the successful venv creation, we can proceed to actually use the environment and download the mininet lib there. The command sequence is below.
mininet configuration using the python lib
Now the whole environment should be set up. It is time to compose the main network’s topology and logic startup script. Let this be named topo_kb2.py. The script is going to be divided into code blocks/listings with further description.
Note: there are sections of wider code syntax, therefore you can use Shift+mouse scroll to move to the side.
libs import
At the top of the script, let us define libraries to import. We are going to use the main() function as a whole (to be refactored into separated functions later).
definitions of nodes
This section shows how each node is defined. Routers are added via the addHost() function, as the libs lack a definition for a virtual router device. IP addresses are assigned only to the very hosts, router hosts (routers hereinafter) are to be configured separately and more explicitly.
| |
links interconnectiong nodes
The following section describes on how to ensure links are added between defined pair of nodes. The order matters, as the interfaces’ names are then named after the node itself with the order number attached (e.g. r1-eth3). The order starts at zero.
| |
upstream link
Here, we are going to fetch the root node (Raspberry Pi device). Then a link is added between the root node and R1 router. The upstream end of the link is assigned 10.1.1.1/30 address, and R1 router receives the first IP address — 10.1.1.2/30 — to communicate with the Internet.
The block’s tail tells that the network is to be built and started.
core routers configuration
By now, the network (nodes) is started — we can configure nodes directly.
The incoming block is to be very verbose — we are configuring core routers. At first, let us assign physical MAC addresses to interfaces facing switches. The switches are using those addresses as default destination for unknown frames.
Then, IP packets routing is enabled, and each interface’s setting is flushed. Each IP address is assigned to the defined interface explicitly.
| |
TCP load balancing
In this block, the TCP load balancing is to be implemented. For the balancing itself, the round-robin nth mode will be used. This mode takes two important flags from the oneliner — every and packet. In the listing below, the flags are set to 2 a 0 respectively. This setting ensures that every second packet suits the very rule starting at packet number zero.
[5]
Note that these rules have to be appended (using the -A flag) to the ruleset, because packet is compared with each rule until suits one line by line.
[5]
| |
manual configuration of switches
The OVS controller for switches won’t be used, therefore all flows need to be defined explicitly.
| |
additional hosts configuration
Let us not forget about the default route to be set for each host, while reflecting the host’s subnet gateway. This will route all the traffic towards the core router(s), and possibly to the upstream.
| |
run internal services as jobs
Now, let us focus on the services to be run on the virtual nodes. The paravirtualized layer is very thin, that means the resources are mostly shared — we cannot use SystemD, because it would interfere with other nodes trying to start such service too.
To bypass this situation, I propose running the services as jobs in the foreground (fg), then switched to the background (bg) as a job. This setup will lead to the various output to be printed when the node is accessed (output in fg is printed out, then the service is put to bg). [6]
| |
mininet’s prompt source
The very last (but not the least) block just ensures the command-line interface (CLI) is started and running. When the CLI is exited, the network is decomposed inc. node links.
deployment
When the script is ready, let us execute the scirpt as superuser (to manipulate with networking and interfaaces mainly):
| |
Ideally, that sequence should produce this output with mininet prompt on the last line.
link and routing test
As soon as the prompt is ready, one can examine the deployed network topology. For example let us check the bidirectional interface link status. Command links will print all defined links and their actual state respectively.
| |
ping and traceroute
To test the interconnectivity between nodes, ping and traceroute tools are very useful. The first listing shows the ICMP ping-pong results, therefore h8 host is reachable from host h1 .
| |
The second listing utilizes the traceroute utility, mainly to show the so-called hops between two defined nodes. Here, host h2 from the 10.1.3.0/27network probes host h5, which is set in the 10.1.3.32/27 network. We can see that the packet hops to router R1 (10.1.3.1), then to router R2 (10.1.2.2), and finally to the remote counterpart, host h5.
To show the core routing in action, let us probe hosts from the subnets behind another router (R2, R3). In the third listing, we can observe another hop between hosts, as the packet(s) flows like this:
| |
zabbix
To install the Zabbix tooling, it is necessary to install their repository first (it depends on the chosen system configuration on the site). [9]
When the repository is installed and loaded, it is possible to install the whole Zabbix tooling (again, depends on the chosen system configuration). [9]
Next, the database has to be created via the mysql command:
[9]
Then initial database schema needs to be imported: [9]
Again, enter the MariaDB mysql prompt and disable the log_bin_trust_function_creators option.
[9]
Now go to /etc/zabbix/zabbix_server.conf and enter the database password you assigned to the newly created database account (zabbix).
[9]
| |
Furthermore, edit the nginx server configuration file (/etc/zabbix/nginx.conf).
[9]
agent and mininet integration
Zabbix Agent configuration file (trimmed, R1 example):
To run Zabbix server, agent, nginx proxy and PHP-FPM processor all in foreground as jobs, we need to add those lines to the mininet configuration (topo_kb2.py):
[7]
| |
frontend and dashboards
To be able to access Zabbix frontend from the “Internet” (upstream) side, we can setup another DNAT rule on the root host to forward incoming traffic on port TCP/8090 to mininet’s edge router port TCP/8080, which is then forwarded to host h1.
Now, we can access the very frontend (via the host itself):
| |
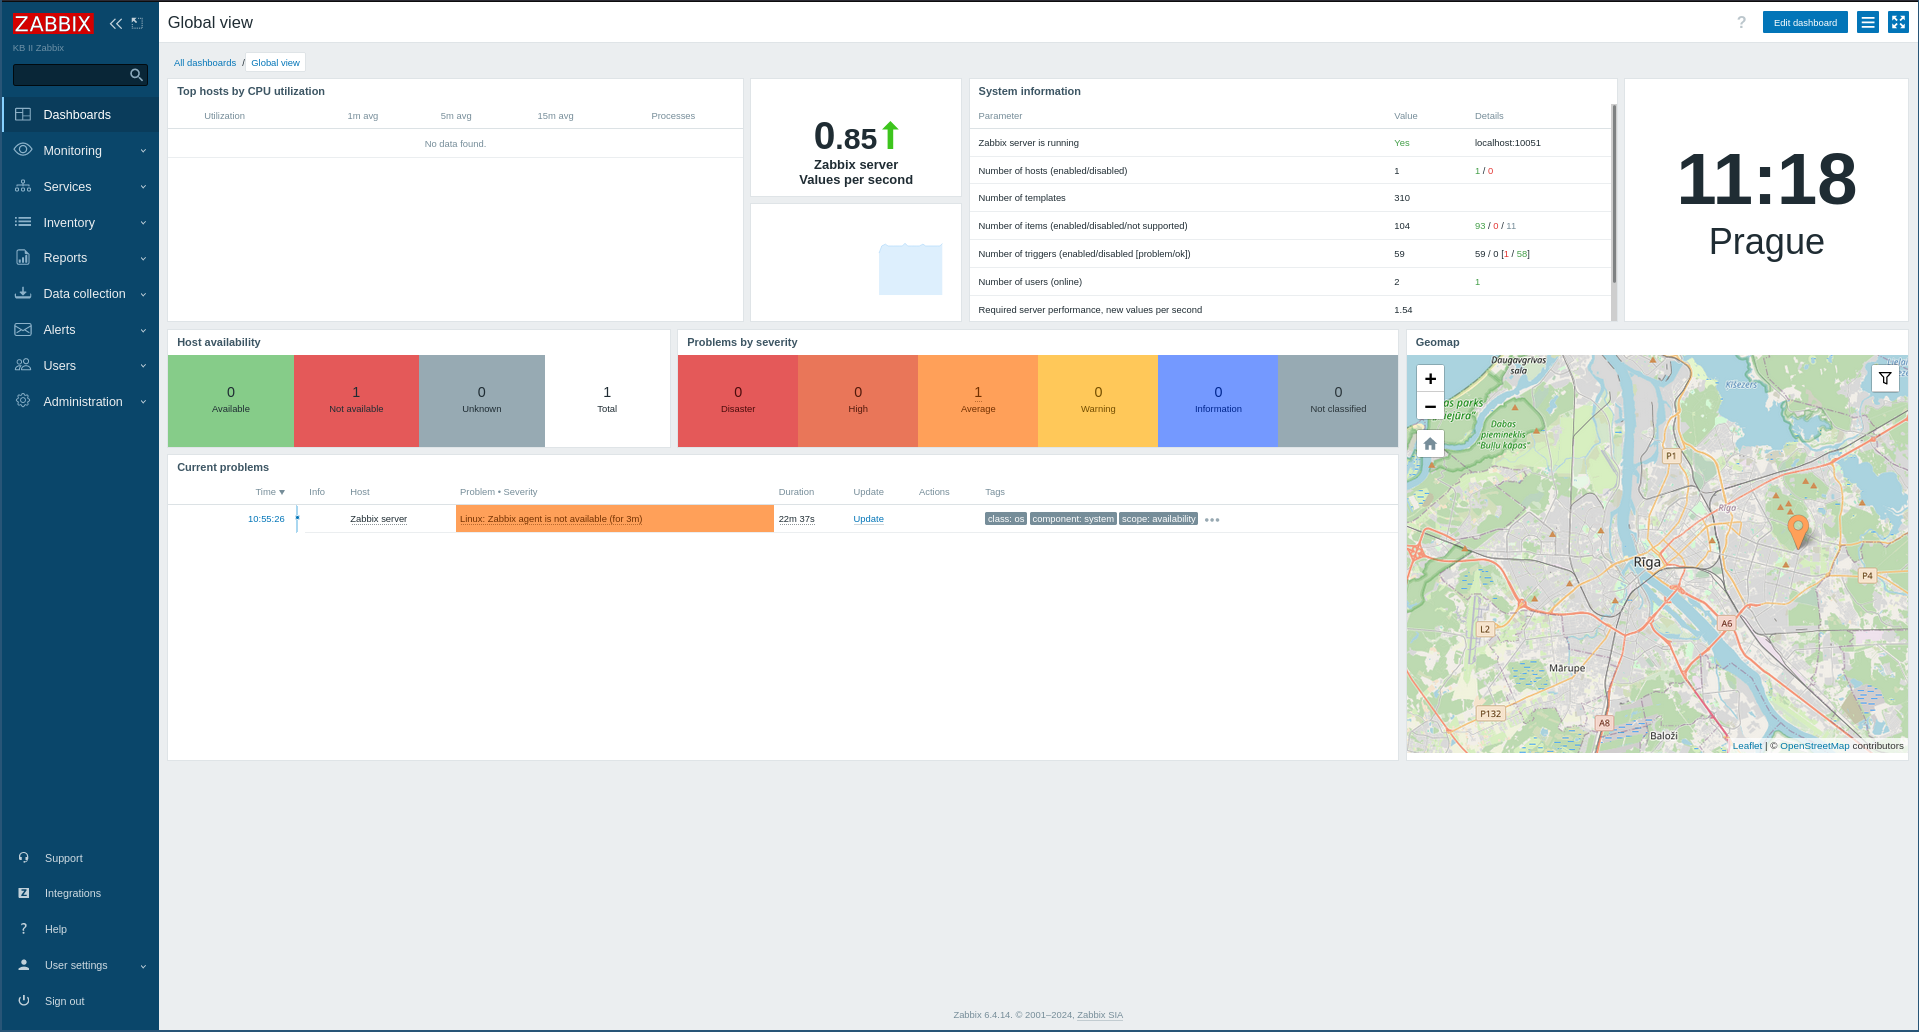 Fig 3: Welcome dashboard after the login. Zabbix.
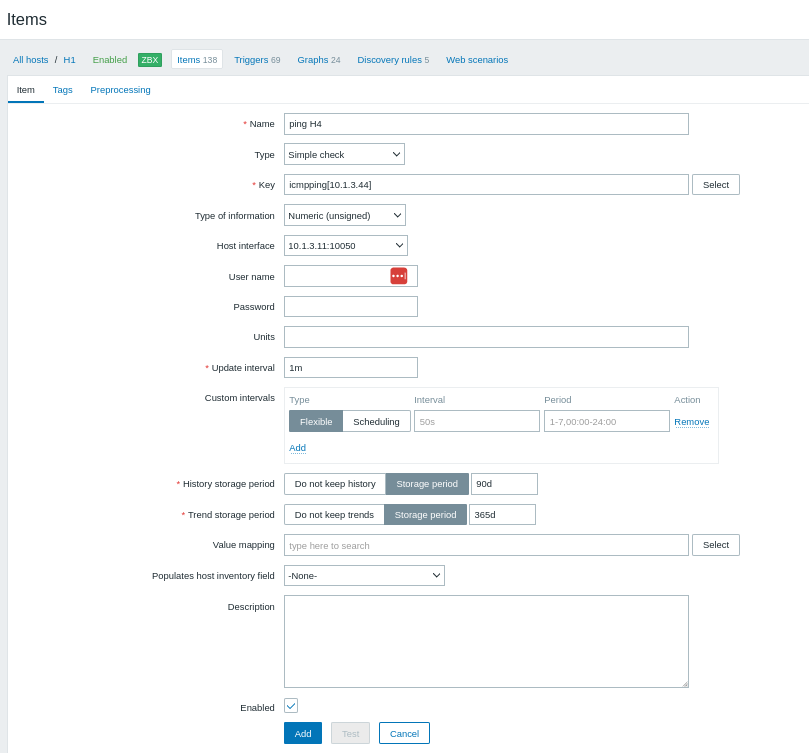 Fig 4: New item dialog. Zabbix.
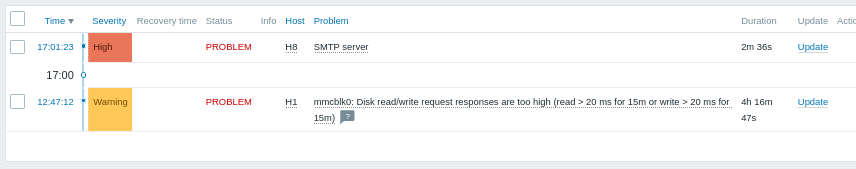 Fig 5: Sample alert indicating that SMTP server on H8 host is not reachable (is down). Zabbix.
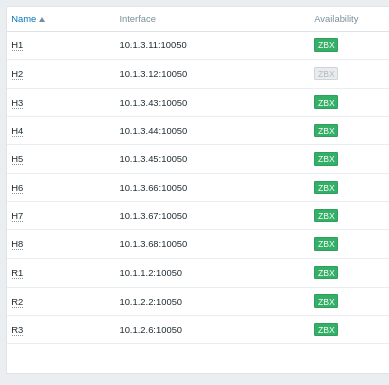 Fig 6: List of all hosts from the project’s network topology, Zabbix agent reachability indicator shown on the right side. Zabbix.
visualization of load balancing
To visualize the TCP load balancing descibed earlier, a simple bash script implementing the curl tool is to be executed towards the core R1 router from the upstream side. Router R1 then should evenly balance ingress traffic between the two subnets. The script prints the iterator i when modulo 1000 is zero as a progress infonote.
[8]
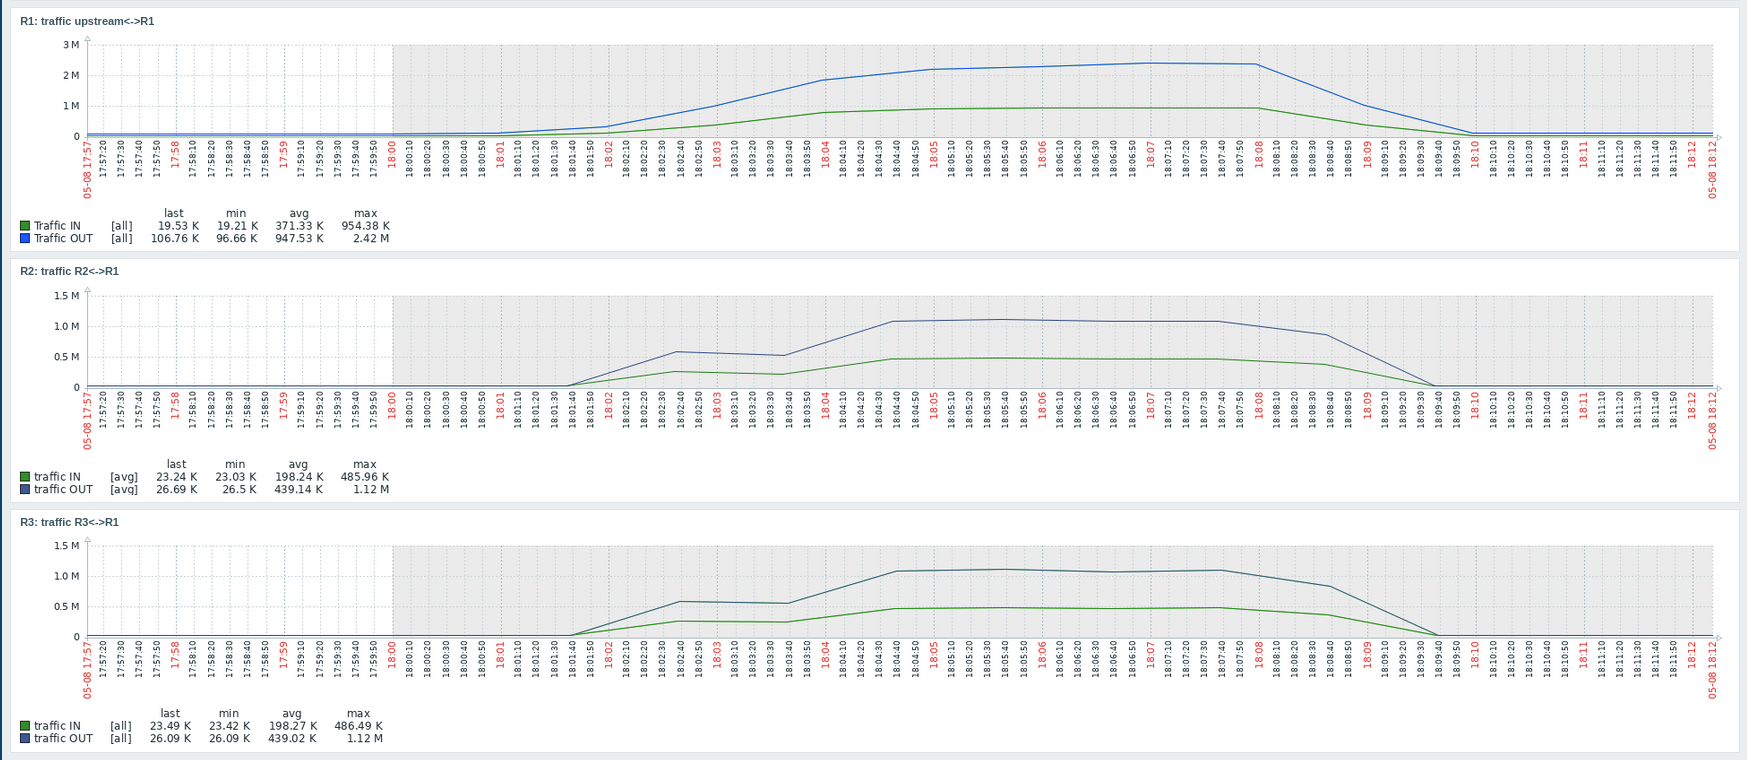 Fig 7: Demonstration of the TCP load balancing in practice. Zabbix dashboard.
In the fugure above we can see a significant increase in traffic on R1’s r1-eth3 interface. Let the unit be bytes. The saturation point of such interface’s ingress hits circa 954.4 kBps. This traffic is then almost perfectly distributed between R2 and R3 routers (485.96 kBps and 486.49 kBps respectively).
[10]
In the end, Nagios tooling won’t be installed and used in demonstration.
conclusion
To sum it up, deploying and configuring mininet tool (using the python mininet lib) had been easy and straightforward. Although the usage of OVS switch/controller tooling wasn’t fully utilized, the routing capabilities of Linux kernel enabled the way for smooth network deployment and setup.
In my honest opinion, I would rather use Prometheus stack (with Grafana, Loki, and more) with dedicated exporters as it is a very lightweight solution for complex systems and networks.